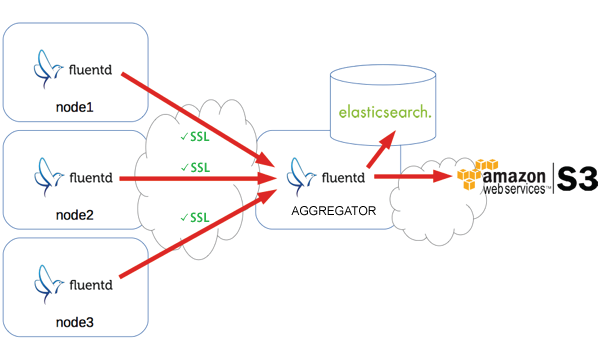
Elasticsearch is an open sourcedistributed real-time search backend. While Elasticsearch can meet a lot of analytics needs, it is best complemented with other analytics backends like Hadoop and MPP databases. As a "staging area" for such complementary backends, AWS's S3 is a great fit. As an added bonus, S3 serves as a highly durable archiving backend.
This article shows how to
In this guide, we assume we are running td-agent on Ubuntu Precise.
Add Elasticsearch's GPG key:
$ sudo get -O - http://packages.elasticsearch.org/GPG-KEY-elasticsearch | sudo apt-key add -
$ sudo echo "deb http://packages.elasticsearch.org/elasticsearch/1.0/debian stable main" > /etc/apt/sources.list.d/elasticsearch.list
$ sudo apt-get update
$ sudo apt-get install elasticsearch
Also, you need to install Kibana, the dashboard for Elasticsearch.
$ wget https://download.elasticsearch.org/kibana/kibana/kibana-3.1.0.zip
$ unzip kibana-3.1.0.zip
By default, Kibana tries to access Elasticsearch at <URL of Kibana>:9200.
In many settings, port 9200 is not open and blocks Kibana from accessing
it from the user's browser (where Kibana runs). There are two solutions here.
If you decide to go with option 2, edit the following line in kibana-3.1.0/config.js
elasticsearch: "http://"+window.location.hostname+":9200",
to
elasticsearch: http://your.elasticsearch.server,
and set up the proxy server so that the requests to http://your.elasticsearch.server
goes to http://your.elasticsearch.server:9200.
To set up Fluentd (on Ubuntu Precise), run the following command.
curl -L http://toolbelt.treasuredata.com/sh/install-ubuntu-precise-td-agent2.sh | sh
Next, install the Elasticsearch plugin (to store data into Elasticsearch) and the secure-forward plugin (for secure communication with the node server)
$ sudo /usr/sbin/td-agent-gem install fluent-plugin-secure-forward
$ sudo /usr/sbin/td-agent-gem install fluent-plugin-elasticsearch
Since secure-forward uses port 24284 (tcp and udp) by default, make sure the aggregator server has port 24284 accessible by node servers.
Finally, configure Fluentd by editing /etc/td-agent/td-agent.conf as follows.
# Listen to incoming data over SSL
<source>
  @type secure_forward
  shared_key FLUENTD_SECRET
  self_hostname logs.example.com
  cert_auto_generate yes
</source>

# Store Data in Elasticsearch and S3
<match *.**>
  @type copy
  <store>
    @type elasticsearch
    host localhost
    port 9200
    include_tag_key true
    tag_key @log_name
    logstash_format true
    flush_interval 10s
  </store>
  <store>
    @type s3
    aws_key_id AWS_KEY
    aws_sec_key AWS_SECRET
    s3_bucket S3_BUCKET
    s3_endpoint s3-ap-northeast-1.amazonaws.com
    path logs/
    buffer_path /var/log/td-agent/buffer/s3
    time_slice_format %Y-%m-%d/%H
    time_slice_wait 10m
  </store>
</match>
Finally, restart Fluentd to enable the new configuration.
$ sudo service td-agent restart
To set up Fluentd (on Ubuntu Precise), run the following command.
$ sudo curl -L http://toolbelt.treasuredata.com/sh/install-ubuntu-precise.sh | sh
On many servers, only root can read to its web server logs. The
following commands give Fluentd a read access:
$ sudo chmod og+rx /var/log/httpd
$ sudo chmod og+r /var/log/messages /var/log/secure /var/log/httpd/*
Also, add the following line in /etc/rsyslogd.conf to start forwarding syslog messages
so that Fluentd can listen to them on port 42185 (nothing special about this port. Any
open port suffices).
*.* @127.0.0.1:42185
Now, restart rsyslogd:
sudo service rsyslog restart
Finally, configure Fluentd to 1) tail Apache access/error logs and 2) listen and parse syslogs
Edit /etc/td-agent/td-agent.conf as follows:
# Apache Access Logs
<source>
  @type tail
  format apache
  path /var/log/httpd/access_log
  pos_file /var/log/td-agent/httpd.access.pos
  tag hostname.httpd.access
</source>
# Apache Error Logs
<source>
  @type tail
  format /^\[[^ ]* (?<time>[^\]]*)\] \[(?<level>[^\]]*)\] (?<message>.*)$/
  time_format %b %d %H:%M:%S %Y
  path /var/log/httpd/error_log
  pos_file /var/log/td-agent/httpd.error.pos
  tag hostname.httpd.error
</source>

# Listen to Syslog
<source>
  @type syslog
  port 42185
  tag hostname.system
</source>

# Ship data to the aggregator over SSL
<match *.**>
  @type secure_forward
  shared_key FLUENTD_SECRET
  self_hostname node1.example.com
  <server>
    host aggregator.example.com
  </server>
</match>
Finally, restart Fluentd to enable the new configuration.
$ sudo service td-agent restart
Much of this solution was based on @miyamae's blog article. Many thanks to @miyamae and any error in this article is solely mine.
Interested in other data sources and output destinations? Check out the following resources:
Want to learn the basics of Fluentd? Check out these pages.
Couldn't find enough information? Let's ask the community!
You need commercial-grade support from Fluentd committers and experts?
©2010-2026 Fluentd Project. ALL Rights Reserved.
Fluentd is a hosted project under the Cloud Native Computing Foundation (CNCF). All components are available under the Apache 2 License.
The Linux Foundation has registered trademarks and uses trademarks. For a list of trademarks of The Linux Foundation, please see our Trademark Usage page.